A quick tour of R’s built-in airquality data with dplyr-free base R and ggplot2, plus a branded theme you can reuse.
Author
Joseph Bailey
Published
October 19, 2026
R ships with a dataset of daily air quality readings from New York, May to September 1973. It’s small, a bit messy, and a great excuse to show off the blog’s ggplot theme.
aq <- airqualityaq$Month <-factor(month.abb[aq$Month], levels = month.abb[5:9])knitr::kable(head(aq), caption ="First six rows")
First six rows
Ozone
Solar.R
Wind
Temp
Month
Day
41
190
7.4
67
May
1
36
118
8.0
72
May
2
12
149
12.6
74
May
3
18
313
11.5
62
May
4
NA
NA
14.3
56
May
5
28
NA
14.9
66
May
6
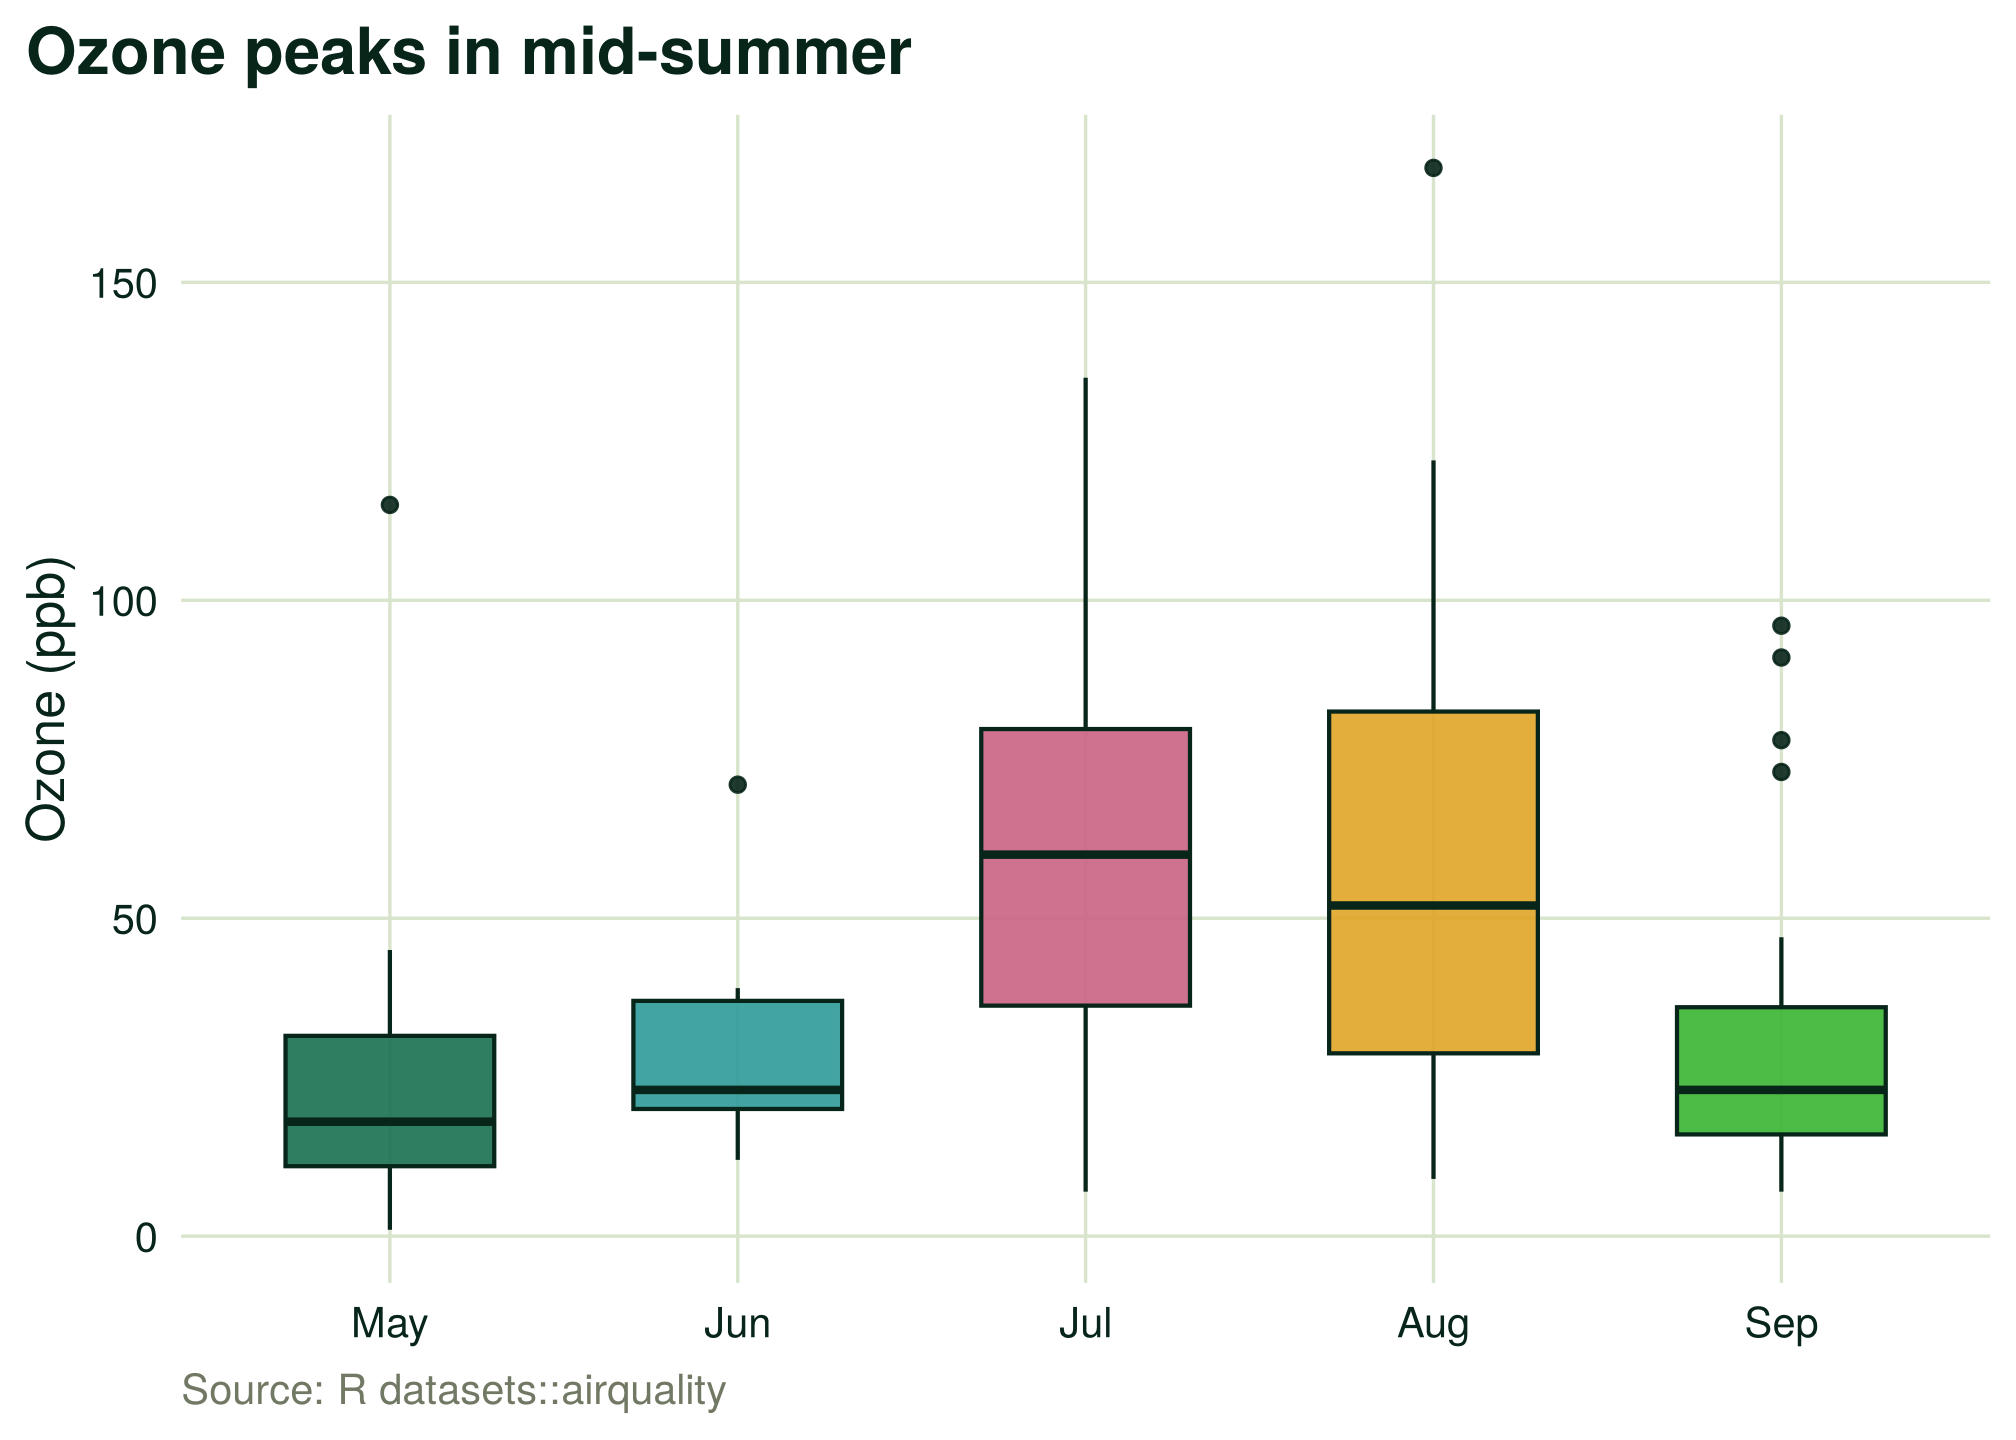
Ozone climbs through the summer
ggplot(aq, aes(Month, Ozone, fill = Month)) +geom_boxplot(width =0.6, colour = fn_cols[["forest"]], alpha =0.9, show.legend =FALSE) +scale_fill_StellarGrok() +labs(title ="Ozone peaks in mid-summer", x =NULL, y ="Ozone (ppb)",caption ="Source: R datasets::airquality")
Figure 1: Daily ozone by month. July and August run hottest.
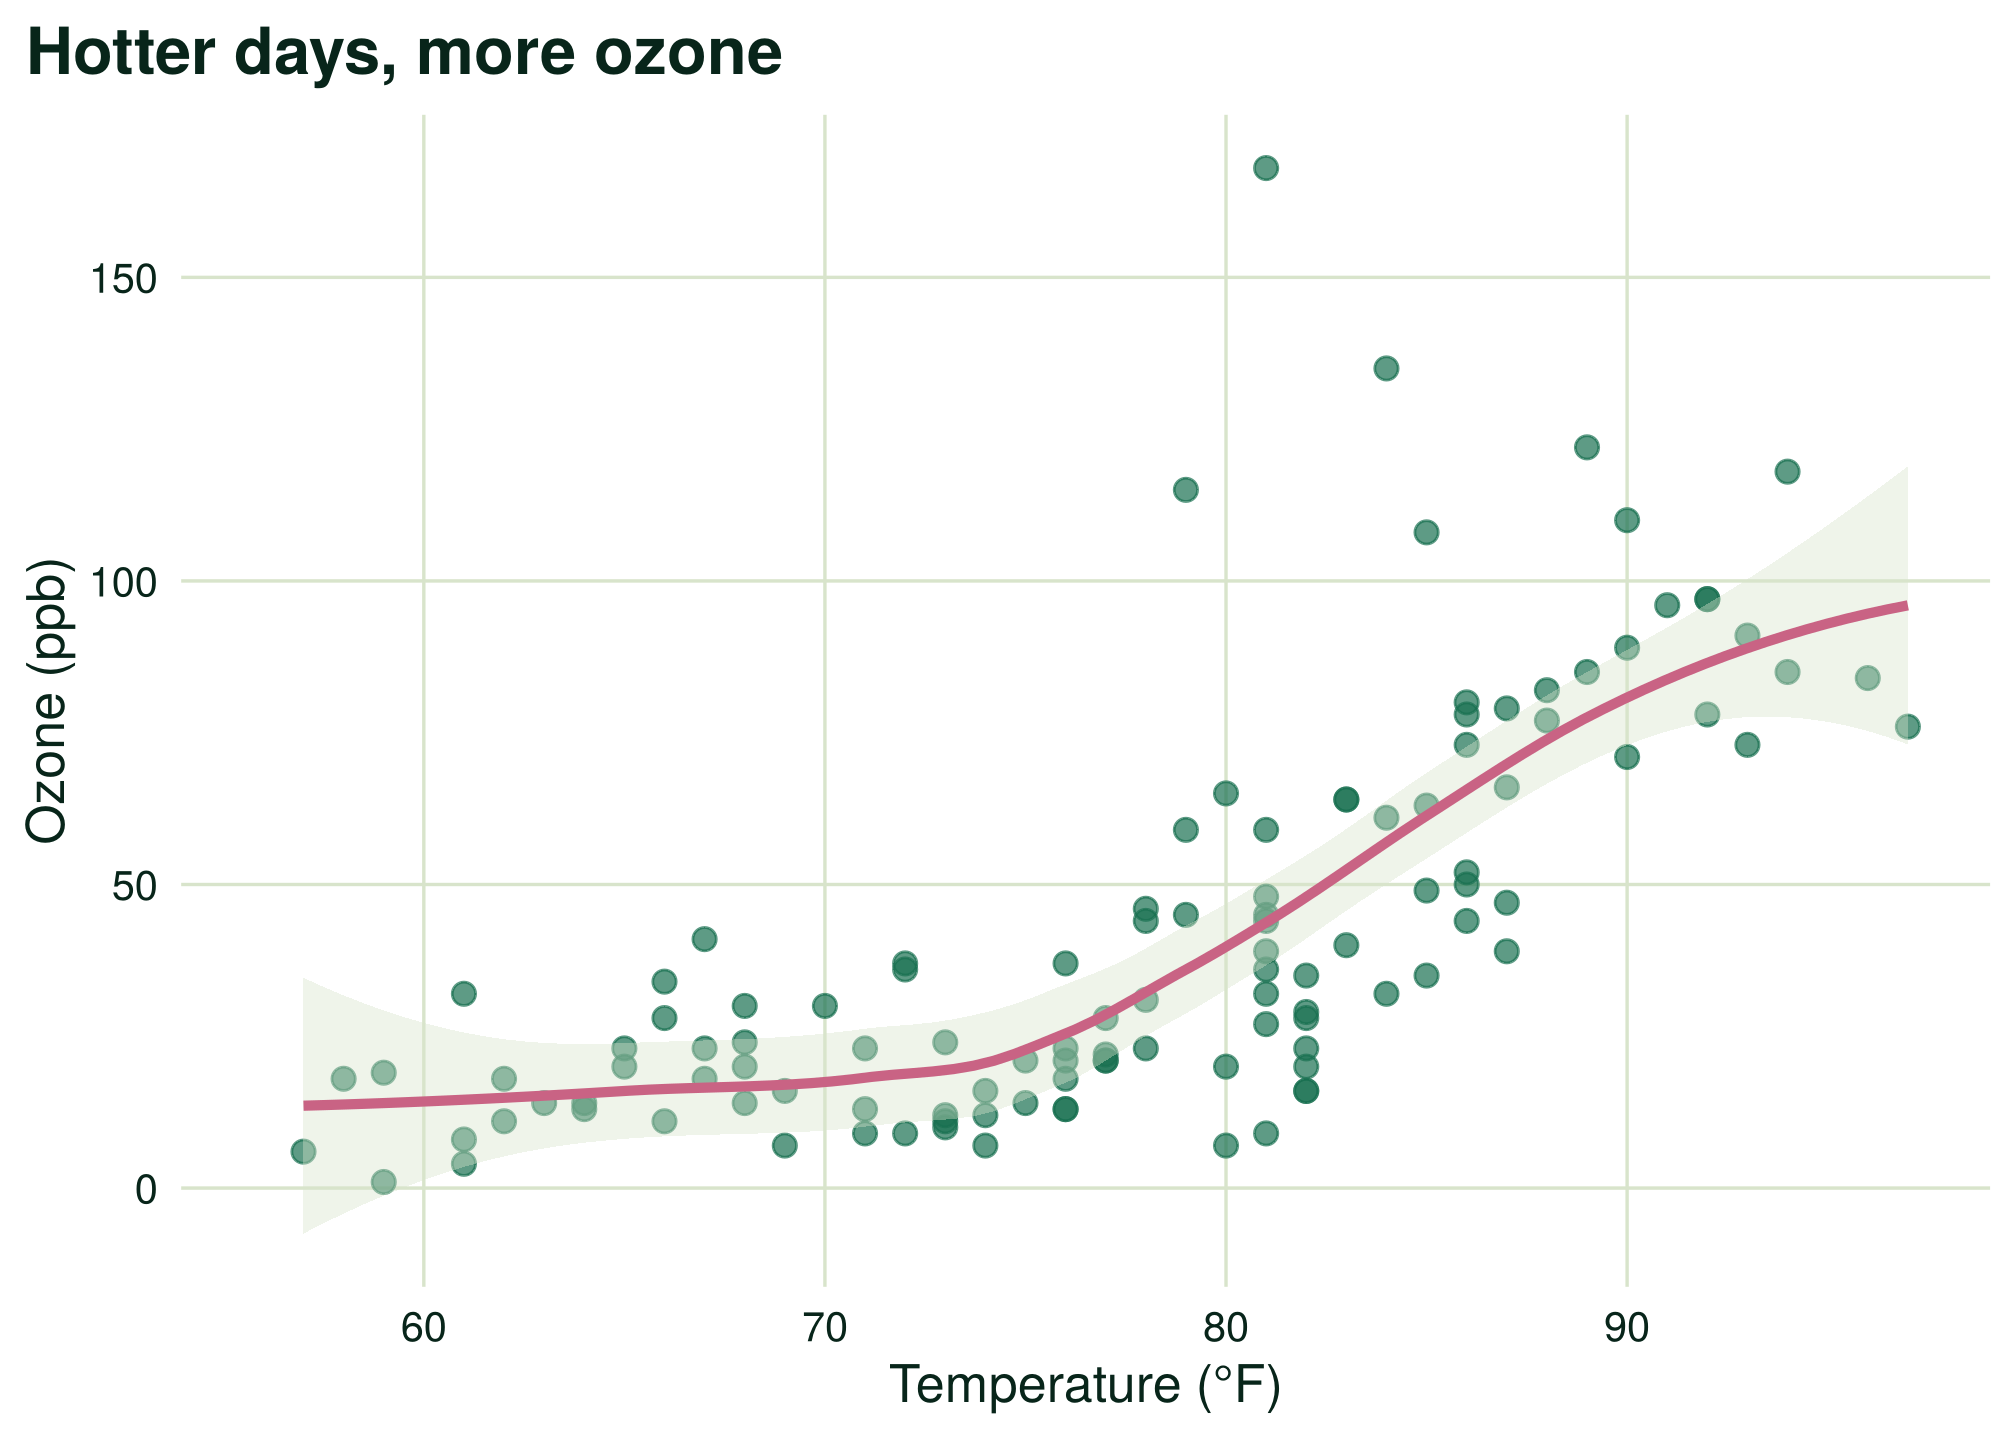
Temperature explains a lot of it
ggplot(aq, aes(Temp, Ozone)) +geom_point(colour = fn_cols[["forest_500"]], alpha =0.7, size =2.4) +geom_smooth(colour = fn_cols[["pink"]], fill = fn_cols[["sage_200"]], linewidth =1.2) +labs(title ="Hotter days, more ozone", x ="Temperature (°F)", y ="Ozone (ppb)")
Figure 2: Ozone against temperature with a loess smoother.
Note
About a quarter of the ozone readings are missing. ggplot2 drops them quietly, which is fine for a sketch but worth handling properly in real work.